A year of full-time day trading
I quit my job for a year to day trade - I wrote a bot, manually traded, and explored the options market a little too! This is the story of how it went.

I took a year off work to learn as much as I could about day trading. Now I'm hooked.
Here's the story of those 12 months, broken into a few phases:
Phase -1: Working full-time: Strategyless, riskless tradevesting
Phase 0: Quitting my job: the plan for a year off
Phase 1: Writing a trading bot
Phase 2: Expanding the bot's arsenal
Phase 3: Bionic trading: the part human, part bot partnership
Phase 4: A spoonful of Options
Phase 5: Working full-time: Strategyless, riskless tradevesting V2.0
Phase ++: Next steps
This is not a tutorial, it doesn't give any specifics about any strategies, nor is it insights into my bank account. Get those dollar signs out of your eyes. It is purely an overview of the journey I took.
If you're still interested in learning some of what I learned, grab a snack! ☕️
Phase -1: Working full-time
Strategyless, riskless tradevesting
This surprises some people, but I am quite risk-averse, especially with finances.
I was working full-time as a software engineer at a large company. The stock portion of my compensation fluctuated like crazy, and I wanted to learn how to take advantage of that, but also didn't want to do anything dumb. So here's what I was doing...
But first, some definitions.
Investing: 💍 it's like marriage. You pledge to have and to hold a high-quality company or ETF for life... or until retirement.
Day trading: 💋 it's like a one-night stand. You want whatever's hot in the moment. You're in and you're out in the same day, and you don't care if you ever see them again.
Swing trading: somewhere in the middle; these trades typically last days or weeks, possibly months.
While working, I was toying around with a combination of swing trading and investing:
Strategy 0: Timing the market on safe stocks
The idea here was simple: try to buy low and sell high on the stocks that I would be investing in anyway, but never realise a loss.
Instruments:
- ETFs and Individual stocks on the NYSE and NASDAQ that I would otherwise be investing in til retirement. Think the S&P 500, Nasdaq 100, Apple, Google, Amazon... (I'm a software person okay?)
Rules:
- Never realise a loss, ever. If we enter some 2001-esque crash and it requires holding til retirement, so be it.
Rule No. 1: Never lose money.
- Warren Buffett
Risk:
- There was no risk of loss, really, other than what I would've already been exposing myself to if I was being a normal investor.
- The opportunity cost of selling too early and missing all the real gains while sitting on the sideline.
Methodology:
- Look, I'm not going to pretend I had a strategy here. It was gut feel. The most scientific I ever got with it was like "if it drops 10%, I'll buy in and hold it back to all time highs".
Tools:
- I used Stake as my trading platform.
Hopes:
- Learn something about the markets by being active in them
Results:
- Look, I'm not going to pretend I measured it. I wasn't doing it for long, either. I suspect that even if I was beating the market, I still wasn't really beating the market. And no, I didn't learn much.
Phase 0: Quitting my job
The ground rules for my year off
June 2020, I left my job. I decided to take one year off to learn everything I could about trading.
These are the guidelines I set for myself.
Rules:
- 12 months, time boxed. Then I must go back to work.
- If I am ever down 15%, I must stop, immediately.
- Treat it like a business. Hope is not a strategy.
Goals:
- To learn. After 12 months, be able to answer the question, "To what extent can trading provide a living income?"
Secondary goals:
- Do not develop a gambling problem
- Do not lose money
- Make money (>$0)
- Beat the market
- Beat $TEAM
- Make a living income
Expectations:
- No success, but at least I'll have tried, and the urge to trade will be out of my system
Phase 1: The trading bot
My first crack at technical analysis
I had wanted to write a bot for a long time, but the complexity scared me. How does one even process thousands of data points a second about trades that are placed on an exchange? (Is it thousands?) And then how does one build a strategy on top of that? At that point you'd have to feed all that data to a machine learning algo, right? And surely someone's already doing that?
Then I found my gateway drug: Candlesticks and technical analysis. Some people say it's astrology, but I found it very useful.
If you know nothing about candlesticks, technical analysis, moving averages, support & resistance, read this. Otherwise, continue on.
Candlesticks
Candlestick charts showed me how simple the data storage and processing of trading data could be.
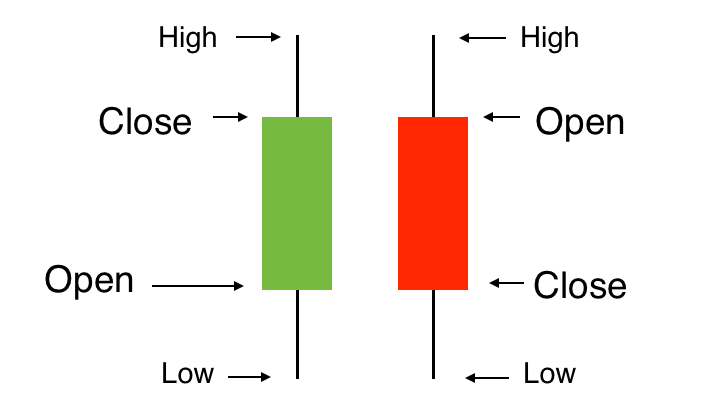
You can distill any time period down into four key data points: The price it started at, the price it finished at, and the highest and lowest prices it reached in that period. No more transaction firehose issues.
Technical Analysis
Technical analysis involves using past trading data to predict future price movement. In other words, it has nothing to do with fundamental analysis, which involves analysing all the business-y stuff: earnings, balance sheet, competitors, TAM, i dunno. Technical analysis was music to my ears, because I knew nothing about the business side of things (and still don't), and finding patterns in charts sounded easier.
If you've never heard of technical analysis or chart patterns, here's a couple of popular examples:
1. Moving Averages
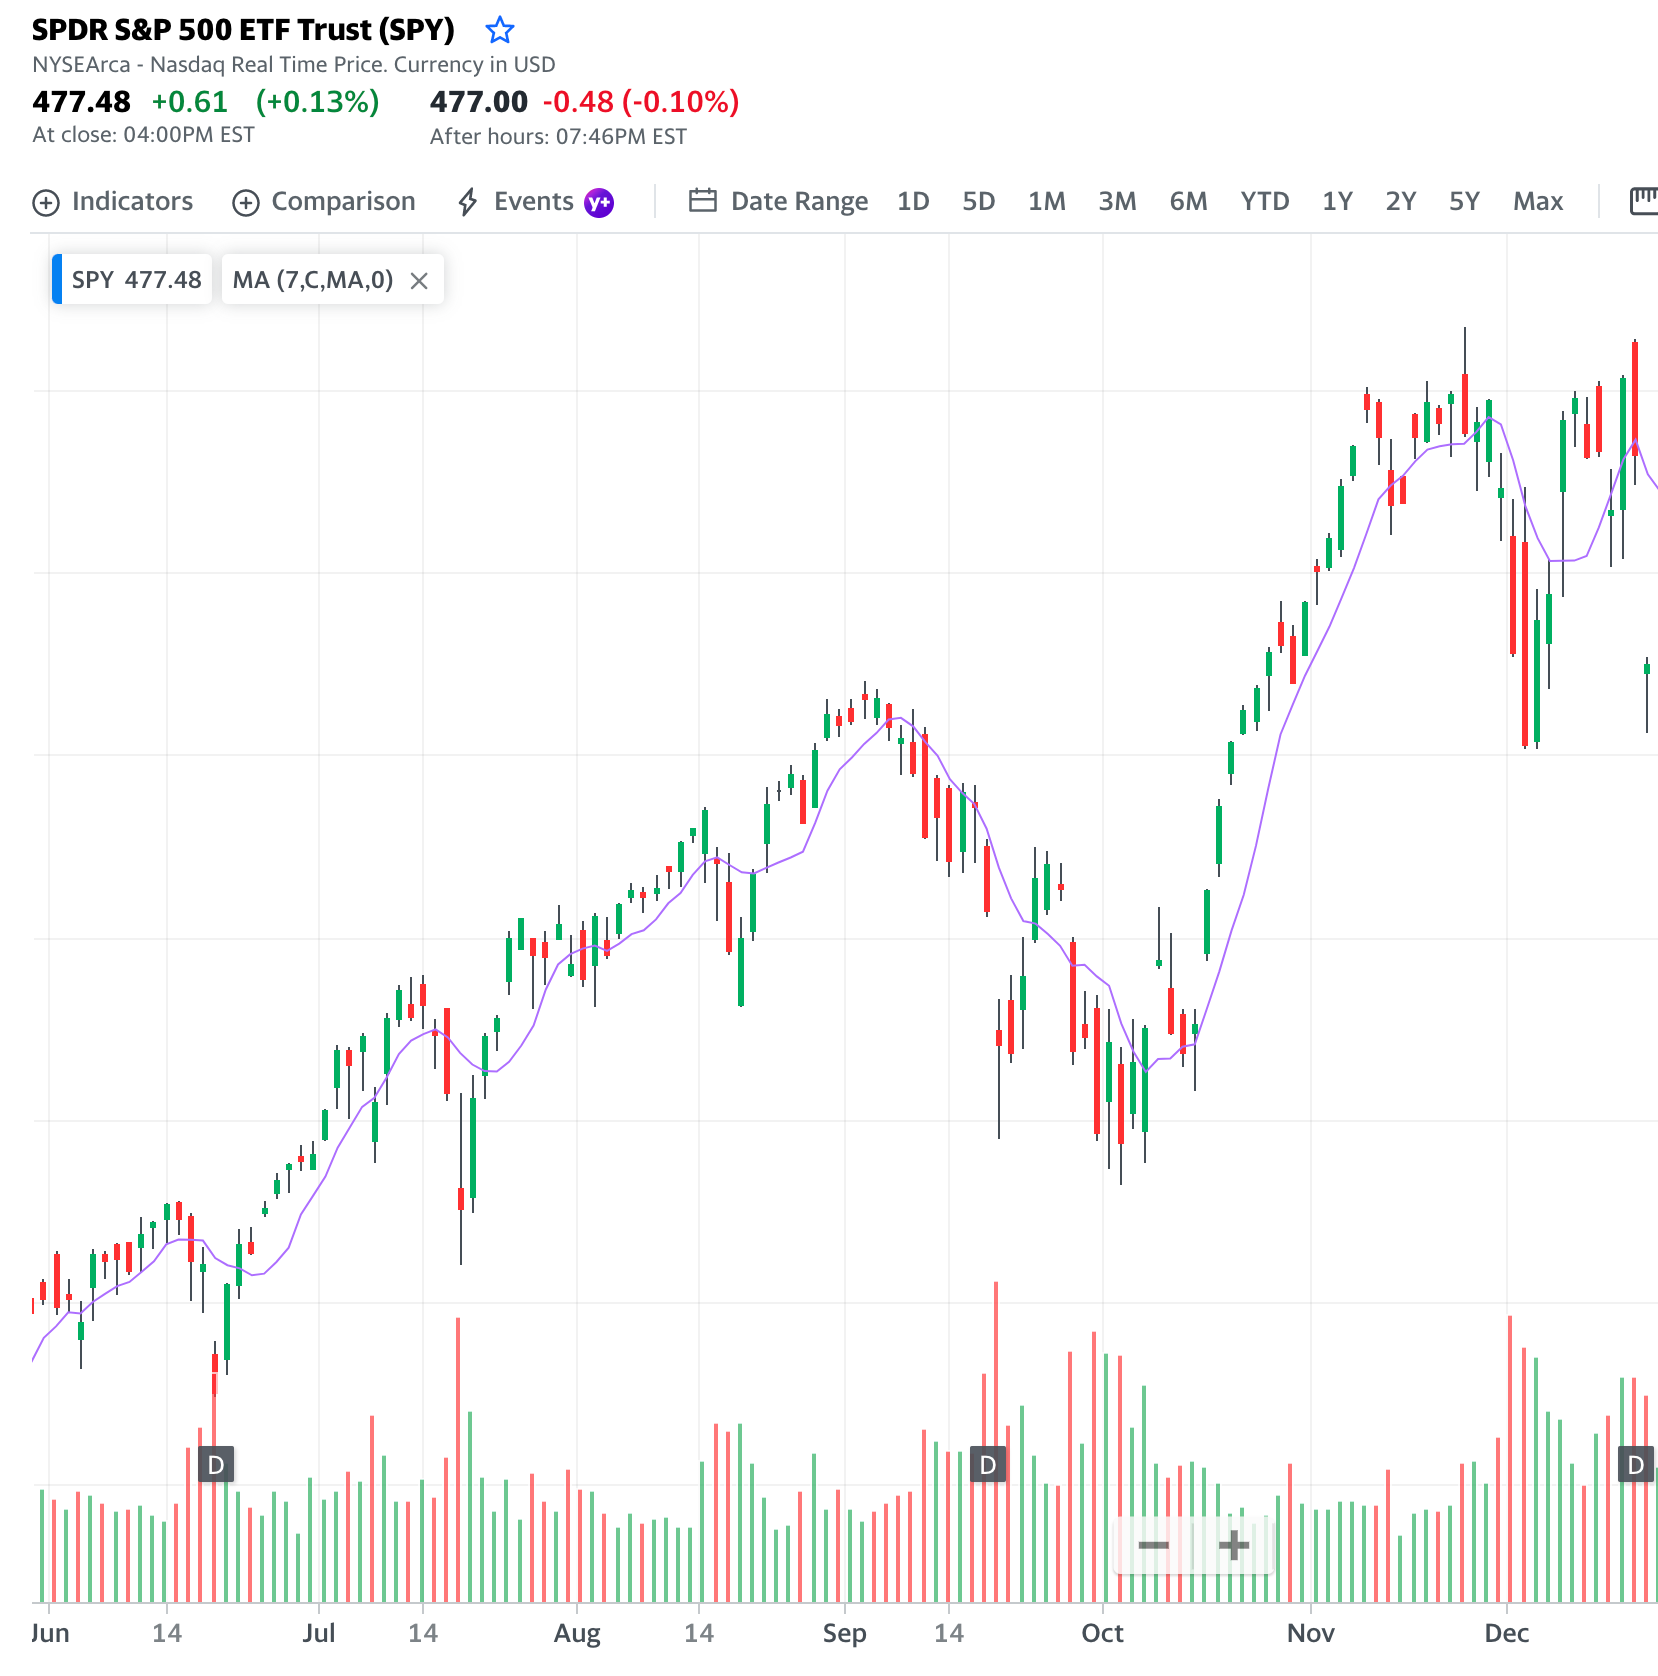
This is a chart of the S&P 500, where each candle represents one day. That purple line is the 7-period Simple Moving Average, i.e. at any point it shows the average of the last 7 candles.
Now, imagine if you bought in every time the chart crossed the rising moving average line, and sold whenever it dipped back below it – looks like you'd make a profit, and looks easy, right? Lets you ride an upward wave, keeps you out of downturns. Next stop, buying a ferrari.
2. Support & resistance, breakouts
Support and resistance are imaginary lines you can draw on charts to indicate the channel it's been trading in.
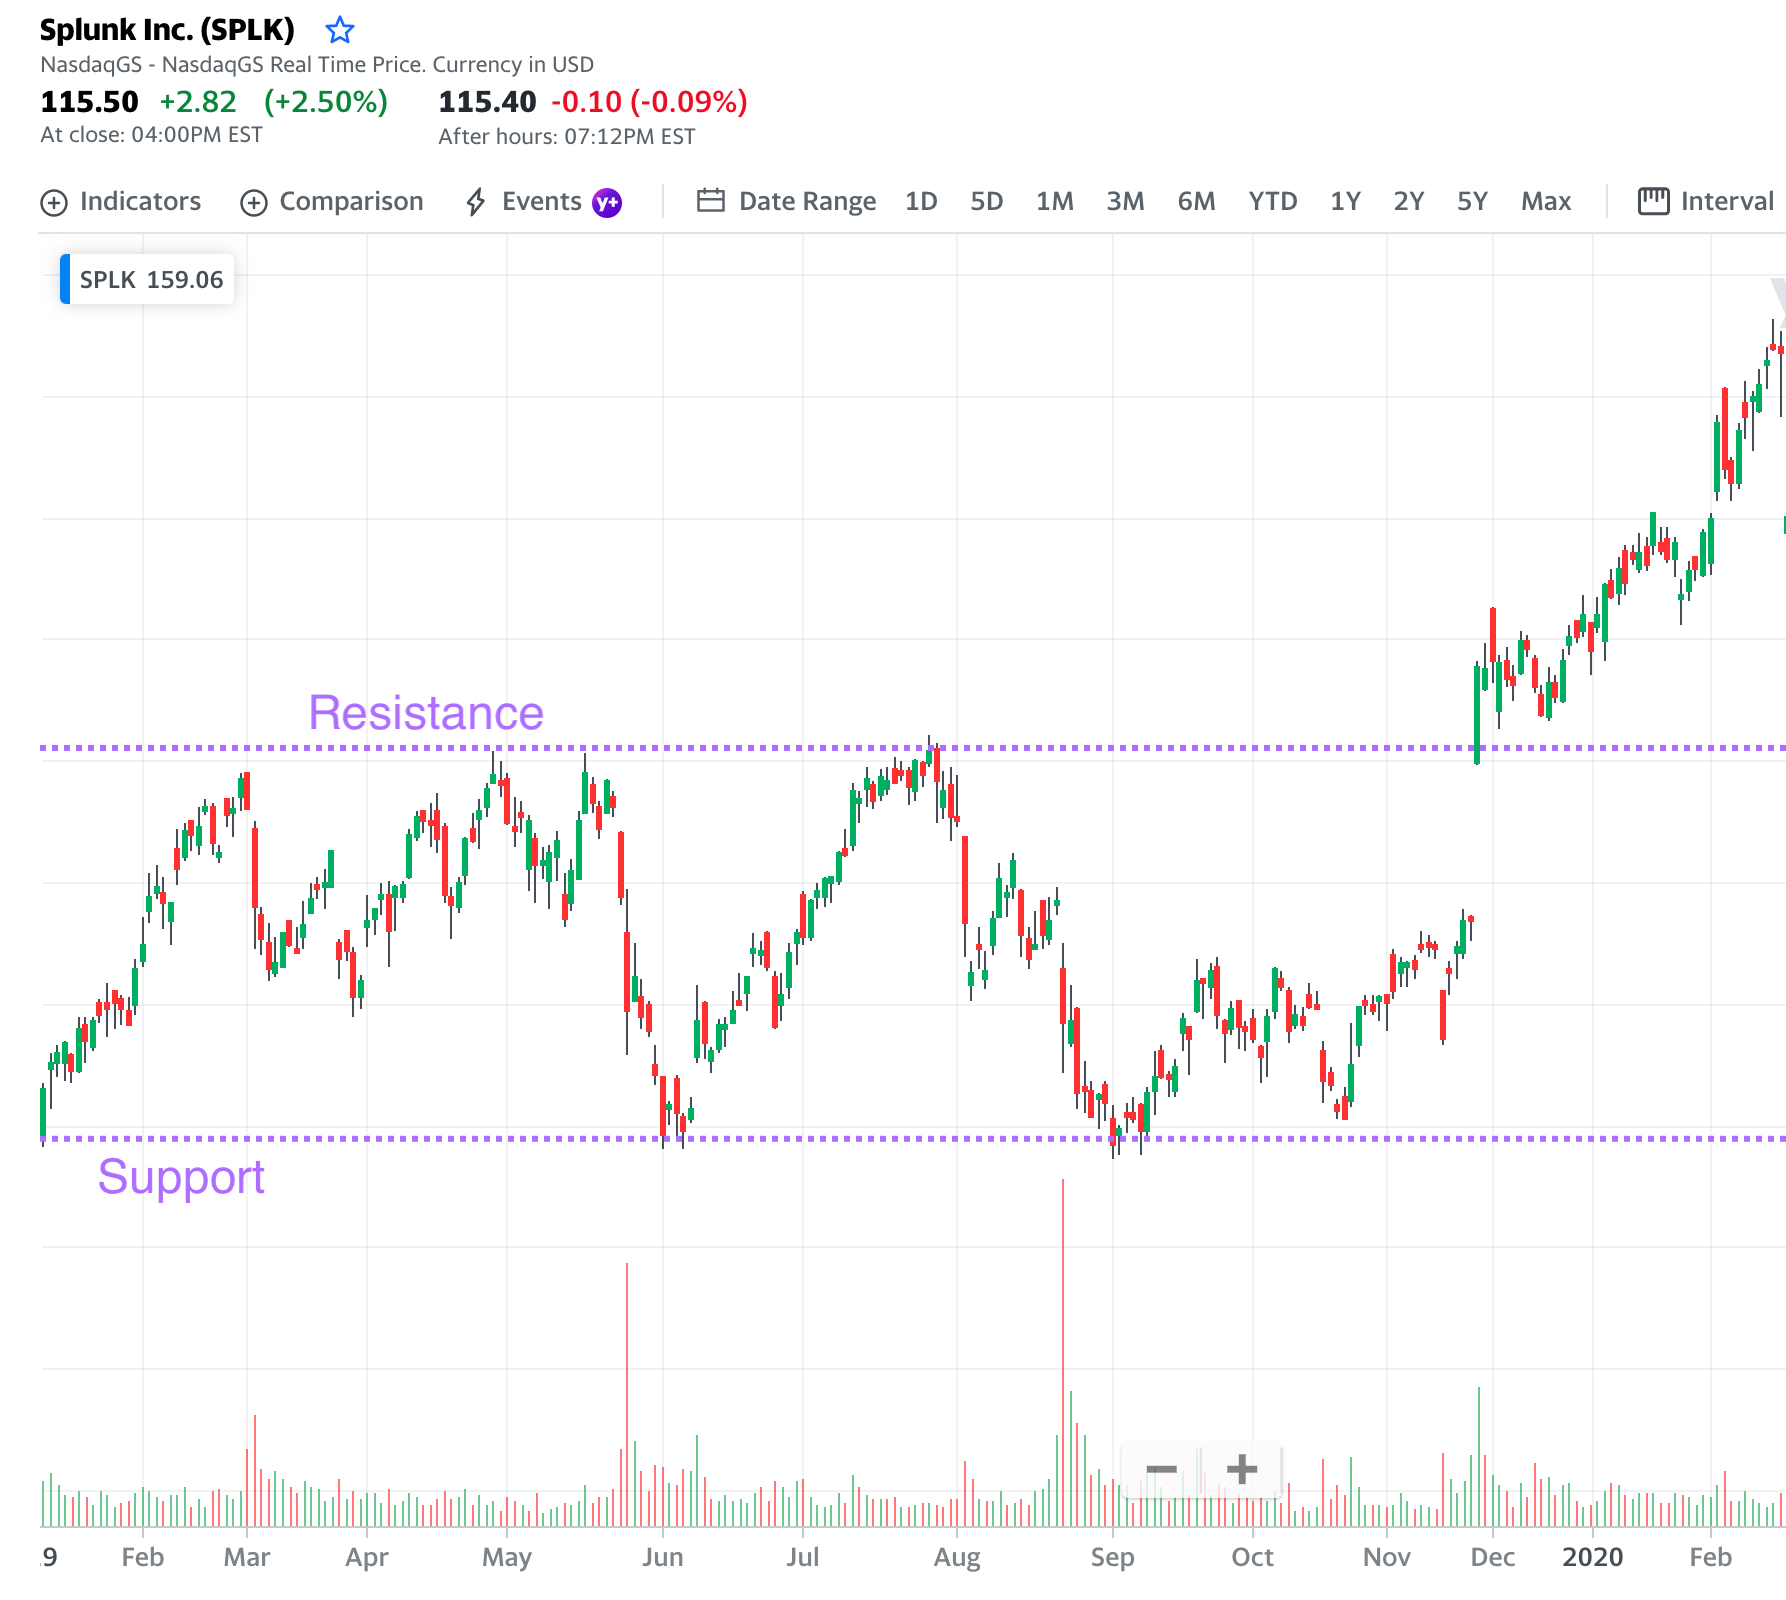
Support is the price it always stays above, resistance is the price where it always gets knocked back... until there's a breakout.
Some traders use support and resistance as entry and exit points, others use breakouts as an entry point as they believe it indicates the stock has room to grow before finding the next ceiling.
These were my gateway drugs. They seemed very easy to code up, test, and tweak.
Writing the bot
The programming
I switched from Stake to Interactive Brokers, since they offered a trading API. I chose to use Java, purely for familiarity since I had no idea how the bot would develop later – would I end up wanting machine learning and Julia? R? Python for the data science libraries? I decided to code up the first prototype in a language I knew well, so I could spend my time learning about the trading world and not figuring out syntax, build tools, and unit testing frameworks. (Spoiler: bot is still using Java). I used sqlite for storing historical stock data.
I coded up some simple strategies, like the moving average one mentioned above, and backtested them across months of data. I'll give it to you straight: these resulted in breaking even most of the time. And I guess that makes sense – if you (basically) randomly buy a stock, and then you sell the same day (often minutes later), you're probably going to break even, statistically speaking.
And breaking even on a strategy is the worst case scenario. Finding a strategy that loses money is great, you can just flip it around to get a profitable strategy.
Developing a strategy
So after breaking even on the first-page-of-google-results strategies, I decided to put some thought into it. A strategy that follows momentum, like the moving average strategy, is going to work best on a stock that is going straight up (or down). So instead of throwing the strategy at any old stock, or changing the strategy, I tried to be more selective with the stock.
So all I needed to do was find the stocks that were going straight up.
Genius, hey. Why doesn't everyone do that?
I went back and forth a lot, but let's cut to the first working strategy I used:
Strategy 1: Momentum trading gappers at market open
Methodology:
1. Before market open, find all the stocks that had moved the most since the previous day. These tended to be companies that had just released earnings or news... not that the bot knew that.
2. Choose the ones that were trading with significantly higher pre-market volume than normal.
3. Filter these stocks down into the ones that have gapped to an "interesting" point on the chart – i.e. support or resistance. (The screenshot of Splunk's breakout from earlier is an example of this). On any given day, there were 5-20 stocks that fit the bill across the NASDAQ and NYSE.
4. Sit back and observe the stock for a minute or two after market open.
5. If it's going up, jump on the train. If it's going down, short it. Doesn't matter whether it gapped up or down overnight.
6. Set exit orders – set a price where I'll bail if I've lost too much money, and set a price where I'll exit when I've made the money I was hoping for (aka stop losses & desired targets). Wait for one of those orders to execute, otherwise exit trade at close of market. Never hold overnight.
Risks:
1. No individual trade could lose me much money, but my lack of fundamental statistical knowledge could see my account bleed slowly. I knew there'd be down days among the up days - but how many in a row would be okay? All patterns stop working eventually right, so when do I pull the plug and say market conditions have changed, vs sit back and say "yep gonna keep running it, down days happen, I am the casino, it will work out"? I set an arbitrary answer to this that would probably make a statistician cry.
2. Unknown unknowns... have I ever written code without a bug? I honestly don't think so. Do I know anything about how trades are executed and how exchanges work and therefore what edge cases to look out for? No. And now my money was on the line.
Tools:
- Interactive Brokers API
- Java, maven, sqlite
- Google sheets (spreadsheets are so underrated ❤)️
Results:
- Not too shabby, still using this today, with several improvements. Buy me a drink if you want specifics.
Phase 2: Expanding the arsenal
Improving the bot's range and accuracy
This phase was about expanding the number of strategies the bot used, as well as tweaking and refining them by taking more information into account.
Building out more strategies
After running the first strategy for a while, I noticed some repeat offenders in failed trades... so I made the bot keep tabs on them. That way, the bot could check to see if the strat would have failed on a given stock in the past – and it used that info to stay out of trades.
But why stay out of a bad trade when you could just take the other side of it?
This provided the inspiration to trade a totally different pattern on these 'failed' stocks, rather than ignore them. And so a reversal-seeking pattern was born into the bot - it would essentially:
1. Take the stocks from Strategy 1's filter
2. Select those that have failed momentum-based strategies before
3. Attempt to find a local minima/maxima, based off this stock's past trading data and some heuristics
4. Take the opposite side of the trade that the momentum strategy would have taken
More strategies were born into the bot in a similar way. Many of them were based on the idea that you can take a simple strategy (think first page of google results for "chart patterns"), and then work from that to find the group of stocks and times of day it might apply to. My bot initially started with an EntrySignal and ExitSignal interface with various patterns extending one or the other, but after backtesting all the combinations of all the entry and exit signals, it became clear that entry signals to the short side are exit signals for a long trade – though exit signals are not necessarily entries.
The strategies I found most success with ended up being based off failed strategies. So, for instance, my bot would monitor for "breakouts", though not actually use them to enter a trade. It would wait for that pattern to fail – i.e. hit the point where I would've put a stop loss had I entered the trade – and enter to the short side there instead.
Using more data points
I knew almost nothing about markets and stocks coming into the year, so every aspect I learned about along the way has been added to the bot's strategies in some way. This included more technical points like float and market cap, but there was more to it.
The bot started with looking at:
- price
- volume
- time of day
of a given stock, and the various combinations of those three data points.
Eventually I noticed that most stocks seem to move together, and that was the end of my bot looking at a stock in isolation. My bot started to make trading decisions for a particular stock by watching the overall market too ($SPY, $QQQ). If $SPY was showing enough bearish or bullish movement, this might affect the bot's decisions on an individual stock.
Then each of price, volume, and time got more detailed.
For instance, time of day was clearly important. Pre-market trades differently to open, trades differently to lunch, trades differently to close and after-hours. They say that "retail opens the market and institutions close it". You can literally see when Robinhood comes online when a particular stock is going crazy with retail (think $GME). And time became important in many other ways – what day of the week it was, what week of the month it was, what month of the year it was, what year of the election cycle it was. But more on that later.
Phase 3: Bionic trading
Part human, part bot partnership
After analysing a bunch of the bot's trades, both failures and winners, I noticed some more data points that were useful – but ones that couldn't be programmed easily into the bot – and the bionic trading phase began.
The overall idea was this: The bot is excellent at emotion-free trading. It doesn't get greedy or scared. It has a handful of strategies it can use, and does an okay job at picking which one to use based on current and past trading data. However, I might be better than the bot at telling it which strategy to use, or not use, based on my interpretation of the catalyst.
Short Data
The first of these un-automatable data points was shorting data – short interest, available shares to short, short fee rates, and short-sale restricted status. I won't go into detail about those since $GME has made them popular, but an early strategy I had was to go long on a stock when there are no more shares available to short. I swear I was doing it before it was cool. The frustrating part about this one is that it very well could be automatable, but the API I'm using doesn't provide that data.
"Fundamental" Analysis
I don't know how to analyse a balance sheet, but I can tell apart a stable company from a pump-and-dump, and that's more than my bot can do. I noticed that Strategy 1, momentum trading off the open, often failed on questionable companies.
These stocks tend to follow what I now call the "mountain biker" pattern - absolutely going down over the long term, with plenty of "ramps" on the way. Here's an example of my favourite stock of 2020: Nikola, a proven scam.
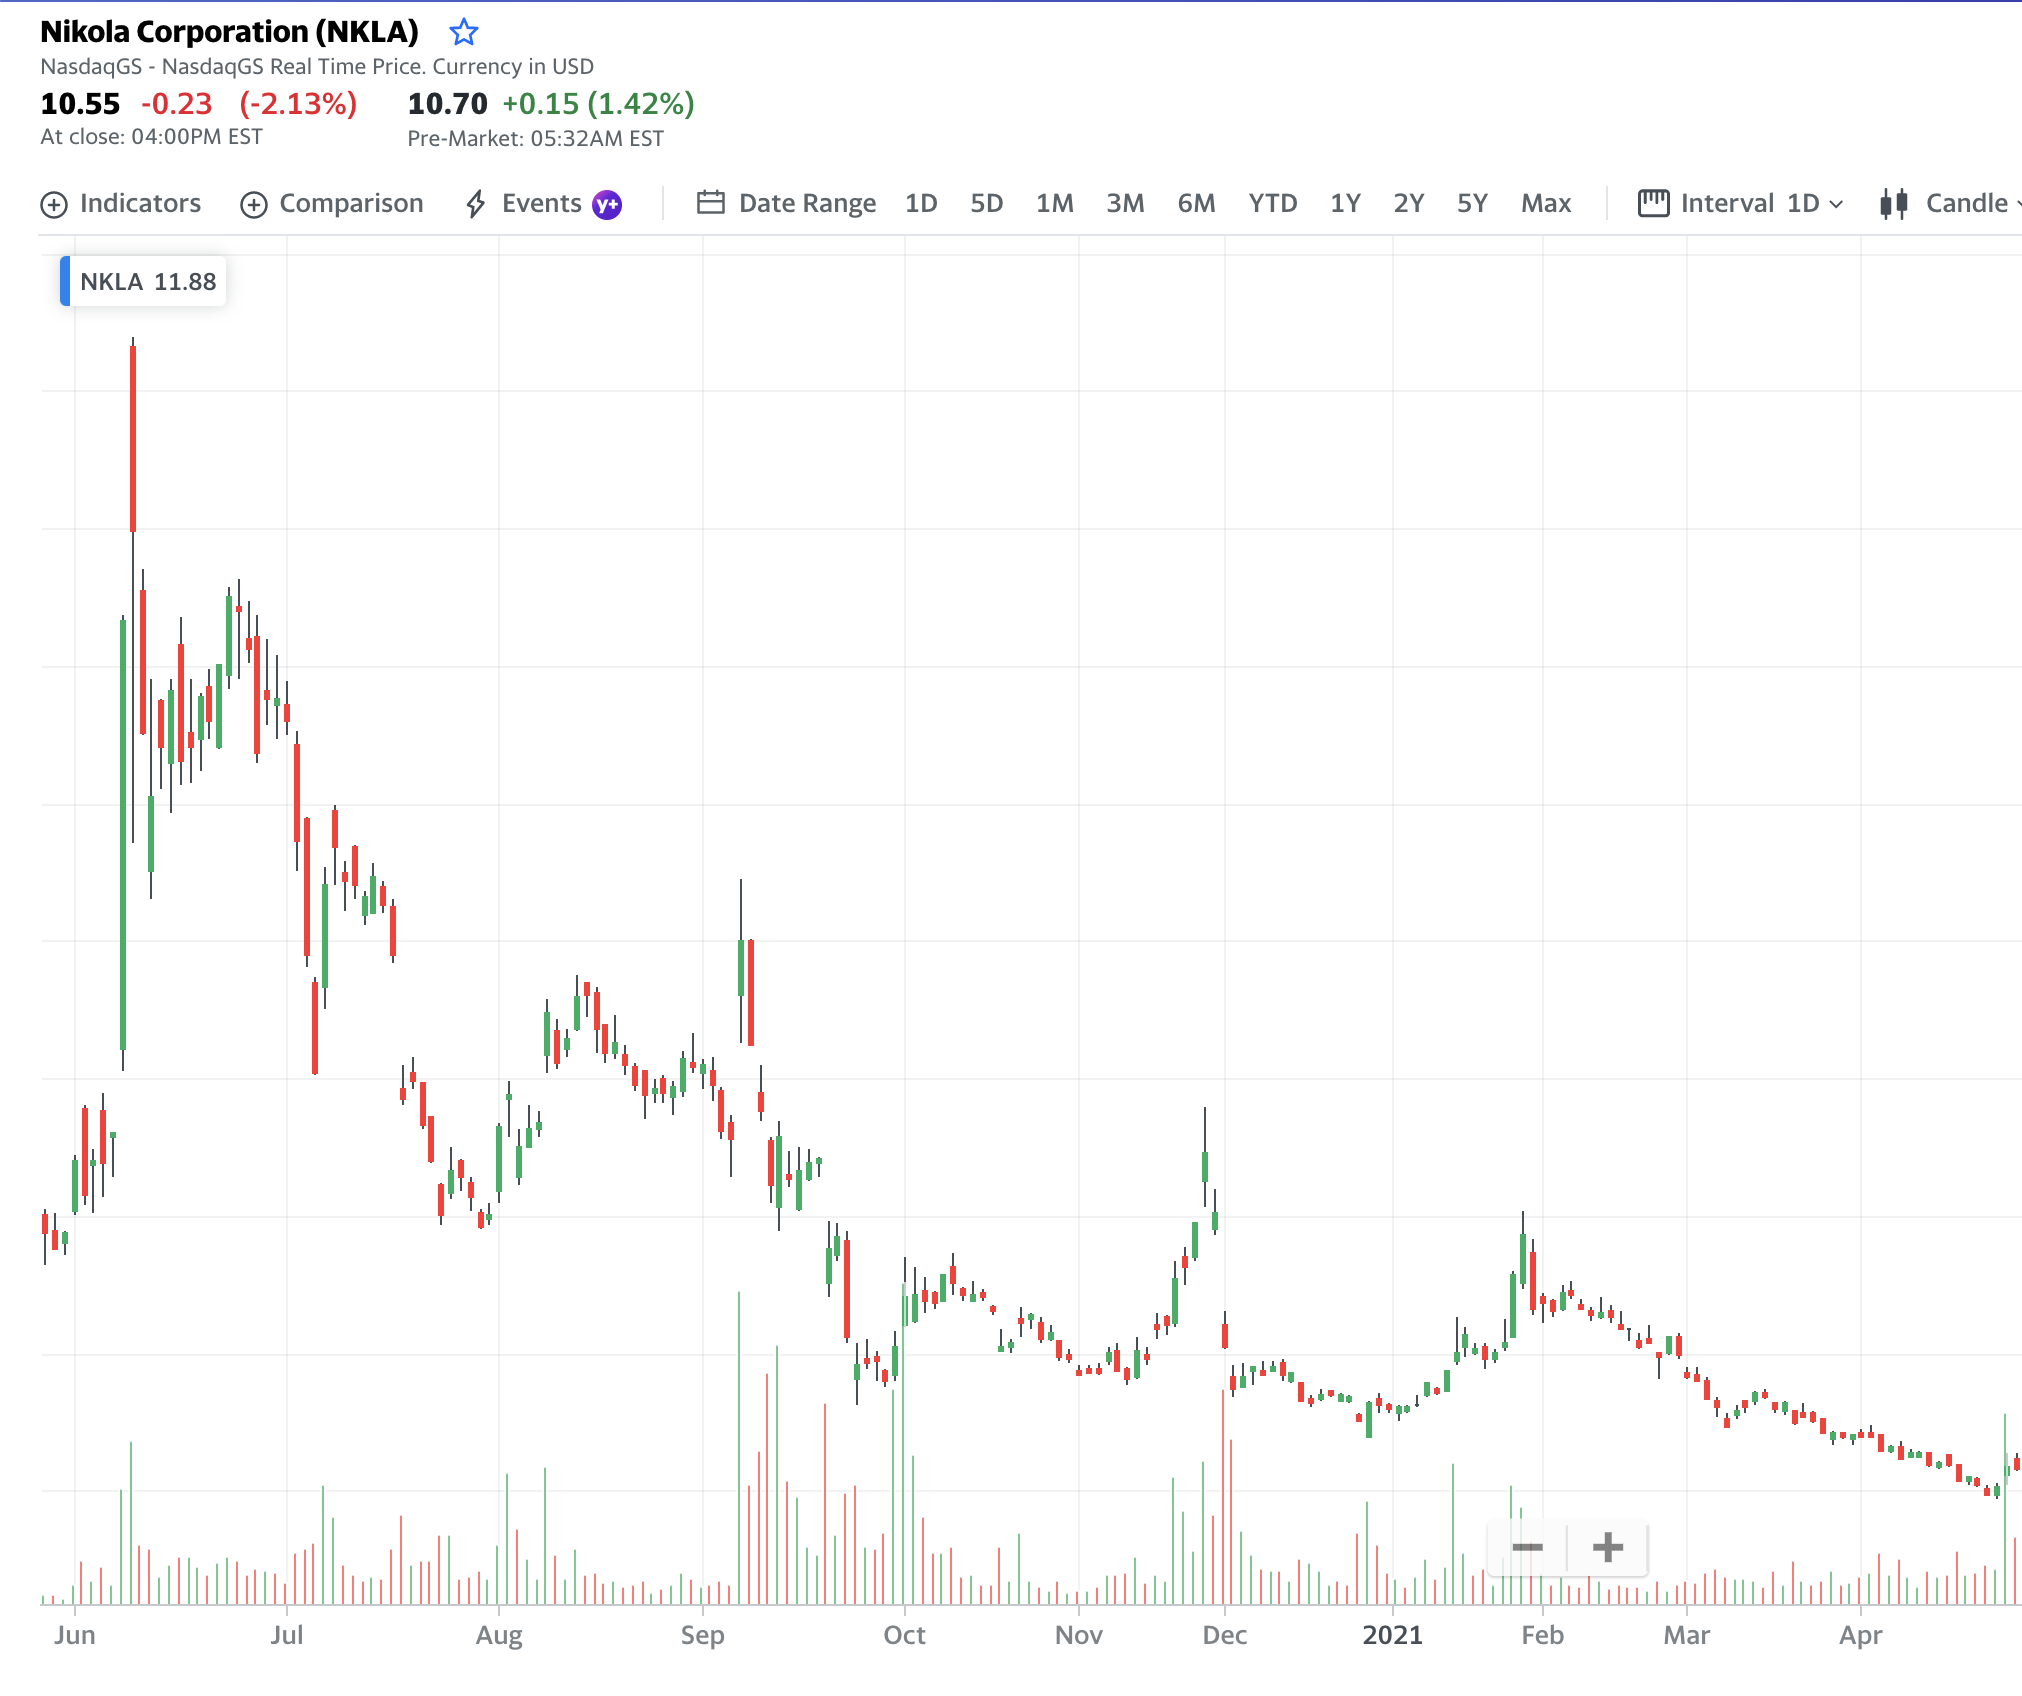
This pattern is quite typical of "meme" stocks – companies that pump and dump, things that get hot on reddit, or things like marijuana stocks that occasionally get a rush of "omg some senator spoke about it so I bet it's gonna be legal tomorrow".
Although I can't use it often, the strategy I have that looks for this pattern is one of my favourites. Essentially it waits for a very high trading volume day, and uses data from the previous very high trading volume days to make decisions. The reason this requires some human intervention is because I have a hard-coded list of companies that have started, or I believe will start, following this pattern. I also remove companies when I think they're too low to be worth it (like Nikola now, adios amigo, maybe see you again one day). Potentially quite automatable, but I'm not there yet.
News Analysis
Sometimes a stock starts shooting to the moon and out of nowhere crashes back down to earth (or the other way around). I would call this a reversal. Deciding whether to trade with momentum vs look for a reversal is a pretty important decision.
I've found that reversals are often a result of fake news, and I am an excellent picker of fake news, if I may say so.
Fake news comes in two broad categories:
- "bad" news about good, solid companies
- "good" news about hyped, pump-and-dump companies, often clearly paid for by the company
I somewhat despise what journalists do, but that kinda makes me love doing this... and, sadly, it provides security for this style of trading never getting stale.
My thesis was that by keeping tabs on news, watching stocks react, and telling the bot which kind of trade to make, the bot would be more successful than working on its own. So far that thesis holds.
Sure, it's more effort and doesn't fall under passive income, which is partially what drew me to a bot in the first place – but to be honest, it's kinda fun and interesting, and I think it's worth it.
Empathy Stocks
As before, stocks move together. And the bot was good at watching $SPY or $QQQ at the same time as an individual stock, and making decisions based on that. However $SPY and $QQQ weren't always the right leader for a particular stock. For instance, back when the Gamestop short-squeeze era happened, it was beneficial to trade $AMC, $BB, $NOK and others while keeping an eye on $GME's movements as the leader at that point. The bot couldn't figure out what to watch, but it was trivial for me to tell it what to watch.
Phase 4: A spoonful of Options
Somewhere along the way I discovered the options market, and it blew my mind.
I kept seeing the same stat repeated everywhere: retail options traders are dumb, and 80% of options expire worthless.
But here's the thing. Options data is public information, so it's easy to see how many options have been traded at any given price level for any expiry date.
In other words, you can see the price and date where 80% of the options would supposedly expire worthless.
So I started using that data. I never traded options directly in my year off, but I used the data it showed to improve my stock-trading abilities. I used options levels to draw those imaginary support and resistance lines in my mind, and they worked so much better.
Options expire on Fridays, and this ended up changing my stock-trading strategies for every day of the week.

On Wednesdays, we start paying attention to weekly options levels, and we slowly get into positions that are kind of playing arbitrage with those. For instance, if the 0ptions data showed a high level of interest at and above the $20 level, and the stock was trading at say $22, then maybe it's a good time to short it.
On Thursdays and Fridays, we go harder in on positions that have diverged from their options levels a great deal.
On Mondays, if any stock the previous week had a high level of options not expire worthless... particularly if they were only just in the money, say it finished at $20.07... we short the heck out of it pre-open.
And of course, there's more to it than that, but that's a whole other post.
I'm at the point now where the bot really only trades its original, untouched strategy on Tuesdays.
Phase 5: Back to work...
Strategyless, riskless tradevesting V2.0
12 months hit, and I was not yet chilling in a beach mansion with a ferrari Tesla, so I went back to work as I had promised myself I would.
Trading while working full-time is a completely different game. A lot of the strategies I'd developed, particularly the bionic ones, weren't going to be viable anymore.
So I went back to Phase -1's tradevesting strategy, kind of. This time with options in the mix.
Strategy: Making dividends from safe but turbulent long-term investments
The overall idea: invest in companies I think will do well long-term, but right now are hot with retail and pretty volatile.
I'm selling weekly covered calls (at the 80% interest level) against either the stock itself or the longest-dated LEAPS at an 0.9 delta, then waiting til the following Tuesday to either re-buy those LEAPS or the stock itself, if the covered calls get exercised... generally speaking.
For those unfamiliar with options: I'll break it down in a future post. For those familiar with options: roast me.
Phase ++: Next steps
Future plans
So, what's next?
Let me start by what I'm not doing next:
- Machine learning. As interesting as it would be to try out, I'm not sure I will ever go into this one – there's a lot more to tick off first.
- Crypto. There's several key reasons I haven't and won't trade crypto any time soon, and probably not whatever reason you're thinking of right now. Crypto is the other thing people get starry-eyed about when I tell them I'm a trader, but alas, I am not going to satisfy anyone's curiosities there anytime soon.
- The ASX. Now look, trading in the US timezone is a certain kind of torture (I'm a morning person). But it's my home ground for now, and that won't change for a long time.
- IPOs. I haven't traded IPOs and probably won't anytime soon. One day, maybe.
- Automated sentiment or news analysis.
What I think I will do next:
I'm still working full-time and keeping busy in other areas of life, but my next TODO's are:
- Understanding options so much better. Build out some models to see how all the fancy greek shenanigans affect things and which levels to pay attention to. Switch from "strategyless, risk-free options trading" to "Strategic options trading with calculated risk".
- Automating options trading – firstly gathering data so I can use it in backtesting, but also building it into the bot's live-trading abilities.
- Automating some of the strategies I have been manually executing. Backtesting them properly.
- Making some human trading connections. This has been a very solo journey thus far. I love sparring with people on any software problem, and would like to bring that into trading.
What I will maybe do after that:
- Learn some fundamental analysis. The idea of a "company valuation" seems extremely flawed to me – I would say it's basically astrology – so I've been a bit resistant to fundamental analysis in general. But I am positive that I'll be a more effective trader the more I know about it. I've got no idea why things move after earnings releases, for instance, so looking into that seems like a good starting point... we'll see.
After a year of trading, I know one thing for sure – no matter what I'm doing in life, I'll never be a regular investor again. Trading has my heart. If you have thoughts or advice for me, reach out!
Whew. I hope this was helpful in some way. ❤️