Timing a stock using the index | $PLTR $QQQ trade
How I use the broader market movements as entry and exit signals for an individual stock.

The video
As a day trader, I never look at a stock in isolation.
I generally don't trade the indexes ($SPY and $QQQ), but I'll watch what their doing to help inform how I should trade an individual stock.
Let me give you an example from last week.
The target
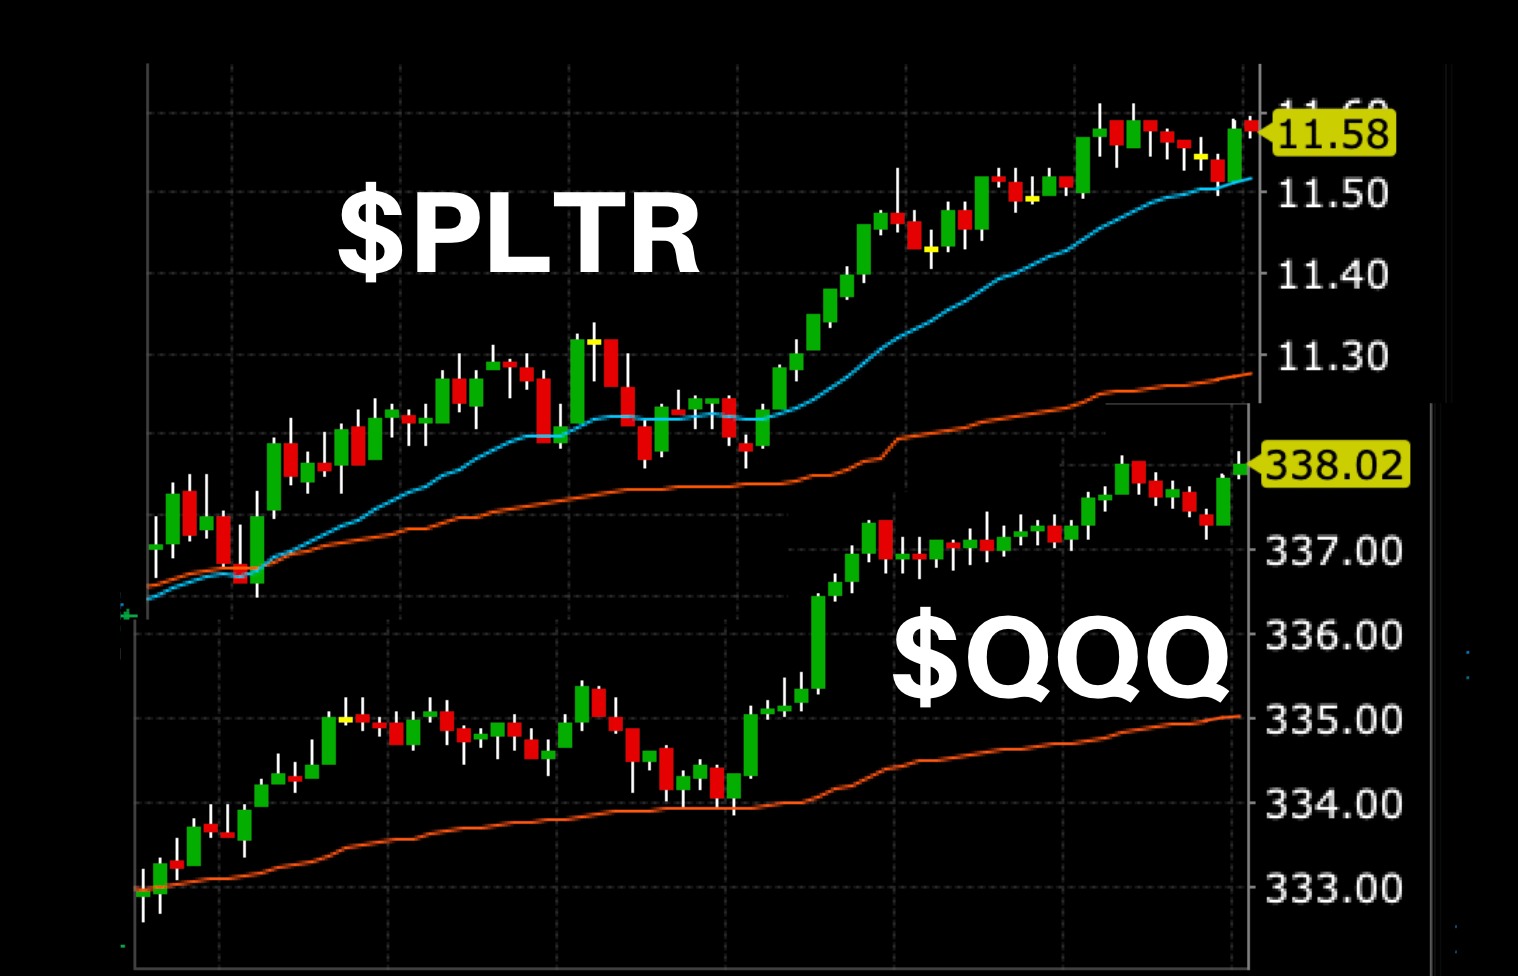
I was looking to trade Palantir ($PLTR), which generally follows the NASDAQ 100 ($QQQ) pretty closely. Seriously, bring up a chart of $PLTR and $QQQ on the same day, any day of the year, and you'll see the correlation.
But on this particular day (Thursday 10th March), $QQQ was down 2% - which is huge - and $PLTR was up about 1.5%. This is a pretty weird discrepancy given the usual correlation. $VIX was 32.
Days like this catch my eye, because there's probably a window of opportunity in there somewhere.
On days like this though, even if one went up overnight and the other went down overnight, the minute-to-minute movement intraday is still relatively similar.
Before I take a trade, I always look for fundamentals... but there were none. There was no reason for $PLTR to be up while the rest of the market was down. No earnings, no news, acquisitions, contracts, nothing. So I was looking at PLTR with a short bias.
The set-up
It was just after mid-day on Thursday.
$PLTR was approaching its high of day, which it had already bounced off a few times – a likely resistance point in my mind.
This was exacerbated by it having gone up 10 green candles in a row. Nothing goes up 10 green candles in a row and just keeps going.
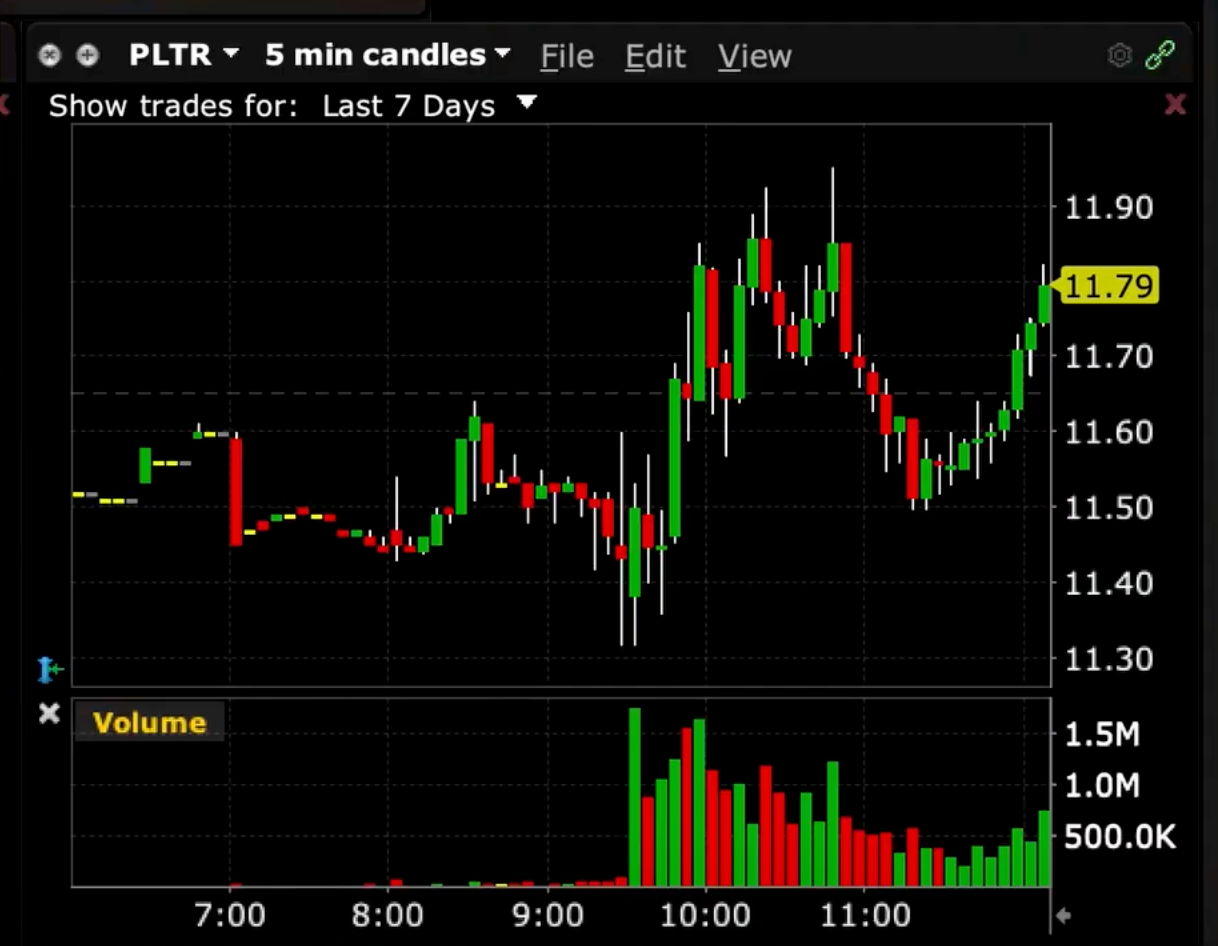
So I was waiting for a pullback. But how to time the top? I could use the high of day, but it might not hit that.
What's the index doing?
I want to check the index for two reasons:
(1) can it help me time an entry? i.e. is the index lining up for a pullback too, and if so, is it lining up with the likely timing and levels of the $PLTR pullback I'm predicting?
(2) are there any red flags? If the index is going to the moon, then I'm not going to short any individual stock.
$QQQ was in an overall downtrend on the day, but at this moment it was heading up a bit - straight into VWAP, the volume weighted average price. (Orange line on both charts is VWAP).
I don't pay too much attention to indicators, especially on indexes, but VWAP is a pretty important one from what I've seen.
My hypothesis was the $QQQ would go along its mini leg up until it hit VWAP, then continue its downtrend. And $PLTR mirrors $QQQ very closely.
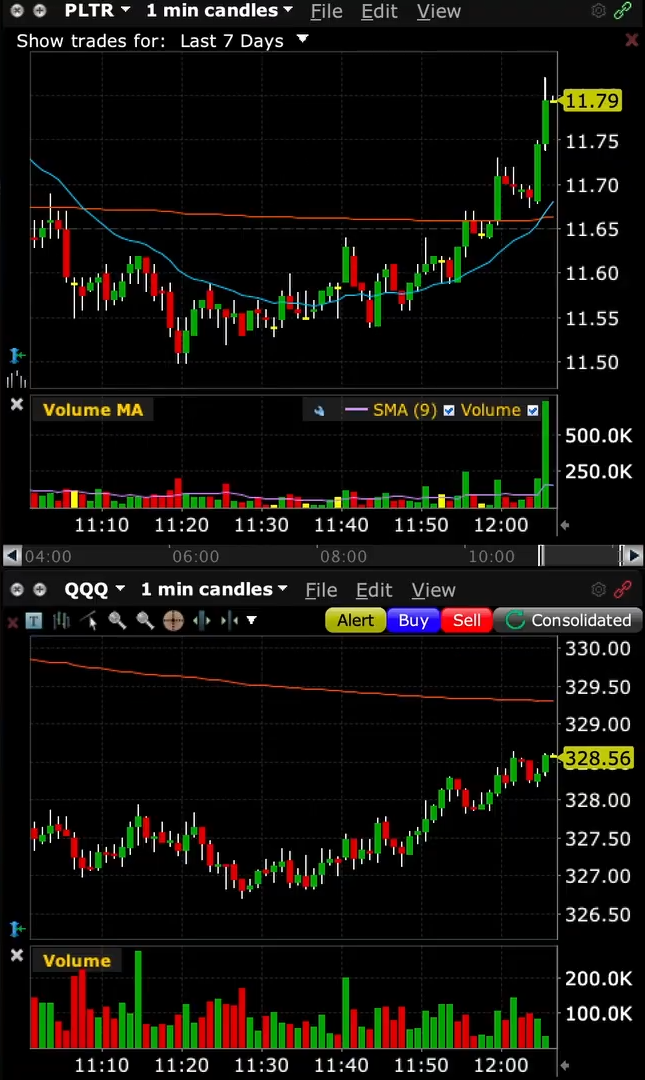
So, the idea was to short $PLTR, either when:
- $PLTR hit its high of day price, or
- $QQQ hits VWAP.
Then $QQQ hit VWAP.
The shorting decision
So I think $PLTR has hit a local peak at around $11.83, with more room to the downside than the upside. This is when I choose whether to short the stock directly, or do an options play.
I'm long-term bullish on PLTR and have a long position, so I decided to sell covered calls in that moment. So, then the decision is, what strike price?
It was a Thursday, and by Thursday I usually have a thesis for where a stock will finish by the end of the week, based on the open interest levels in the options market.
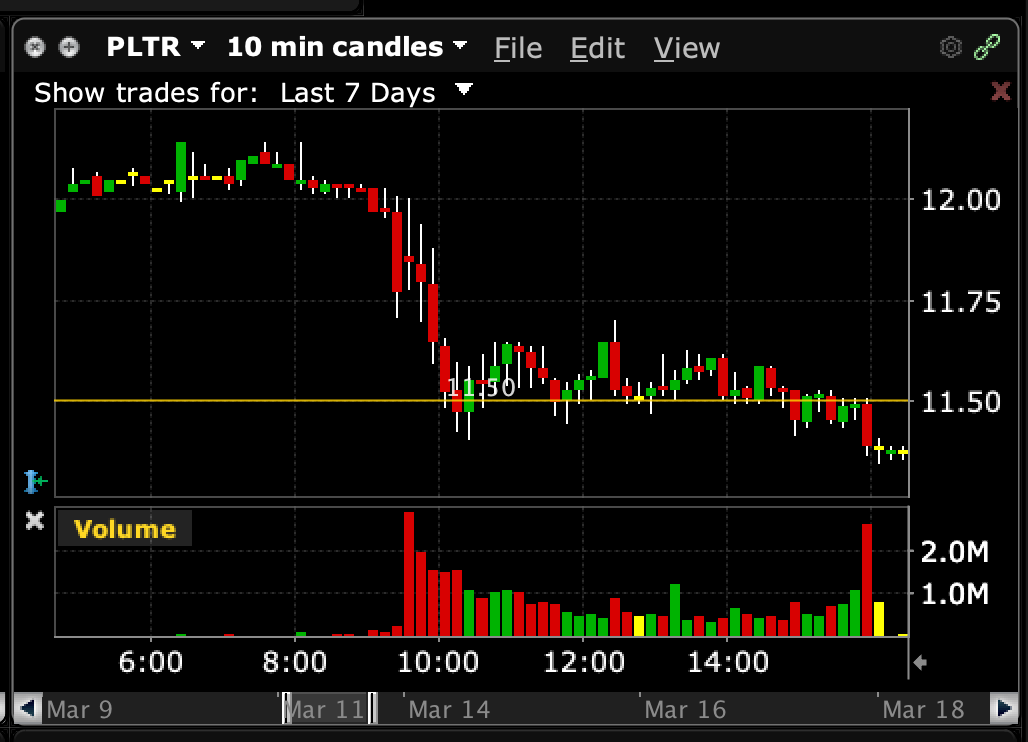
The $11.50 strike had a large amount of open interest, and my thesis was $PLTR would finish below that price for the week. The $12 strike also had a fair amount of interest, so I was even more confident it would finish under $12.
The $11.50 strike was selling for $0.49/$0.50 ish - so that's what I went for. The breakeven would've been $12, and I was relatively confident it wouldn't finish above there, so I'd just have profit. I would still be safe if it did go above that though, as I'm happy to sell my underlying position in the event it is above that.
So, I sold the $11.50s for $0.49c or so.
And what do you know, $PLTR finishes the week right below that $11.50 level.